

Long-Read Based Transcriptome and Isoform Expression Analysis
A) Overview of Long-Read Based RNA Sequencing Analysis
Short-read based RNA sequencing (e.g., Illumina) is well-suited for large-scale expression quantification, offering high coverage and a low base error rate. However, due to read lengths of only tens to hundreds of base pairs (bp), it is difficult to capture full-length isoforms in a single read. This presents fundamental limitations in deciphering complex splicing structures and quantifying novel isoforms.
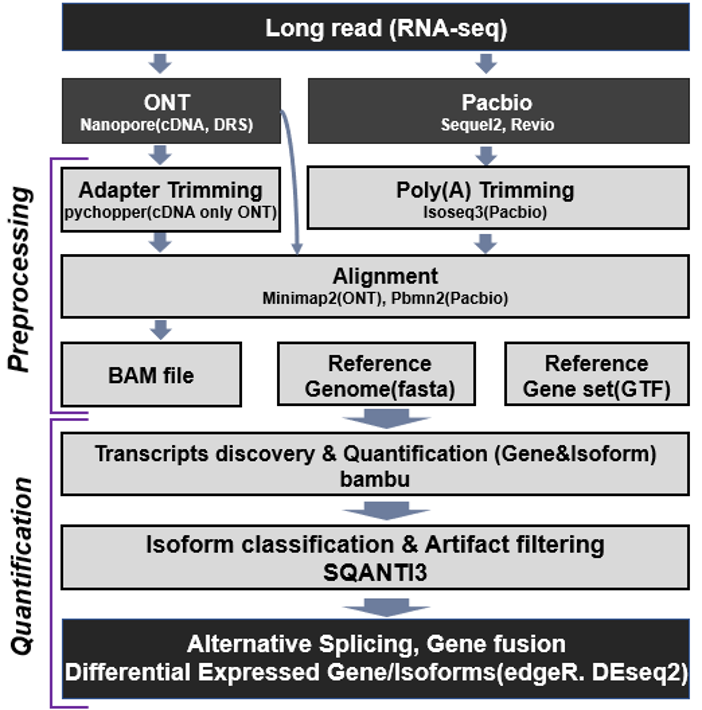
These limitations can be overcome with long-read based RNA-seq. Oxford Nanopore Technologies (ONT) and Pacific Biosciences (PacBio) provide long reads ranging from several kilobases (kb) to tens of kb, enabling the direct sequencing of full-length mRNA at the single-molecule level. This document describes the overview and procedures for transcriptome and isoform expression analysis based on a long-read RNA-seq pipeline (Figure 6).
B) Long-read base RNA sequencing analysis Method
-
Data Processing
The preprocessing step is a procedure for cleaning low-quality base sequences that can compromise the accuracy of quantification and alignment. Long-read data has a high error rate; if these erroneous sequences are not removed, mapping accuracy will decrease, potentially leading to incorrect results in downstream analysis. The pipeline presents different preprocessing tools for ONT and PacBio data, respectively.
First, ONT offers two methodologies: cDNA sequencing and Direct RNA Sequencing (DRS). cDNA sequencing involves synthesizing cDNA using RNA as a template and then sequencing the cDNA. In this process, primers and adapters are added, and their removal is necessary to ensure the quality of the base sequence. Pychopper is a tool specialized for identifying and removing such primers and adapters contained within cDNA reads.bashpychopper –i input.fq \ -o output.fq \ -k cDNA_SSP_VNP.fas \ -r chopper_report.pdf \ -u unusable.fqIn the case of Direct RNA Sequencing (DRS), it's a technology that directly sequences RNA molecules without undergoing cDNA synthesis or PCR amplification. This approach doesn't use a separate tool for processing adapters; instead, it utilizes the soft-clipping feature of an alignment tool like minimap2.
On the other hand, PacBio data is preprocessed using the Iso-Seq3 pipeline. First, the same molecule is read multiple times to generate a consensus sequence, known as a Circular Consensus Sequencing (CCS) or HiFi read. Following this, adapters and primers are removed using lima. Then, in the isoseq3 refine stage, the poly(A) tail is trimmed to select for Full-Length Non-Chimeric (FLNC) reads.bashlima ccs.bam isoseq_primers.fasta flnc.bam | \ isoseq3 refine --require-polya output.bam \ isoseq_primers.fasta flnc.bam -
Alignment
To handle challenges such as high base error rates (especially in ONT), complex splice junctions, and regions with numerous repetitive sequences, long-read alignment utilizes platform-specific, splice-aware mapping tools. For ONT data, minimap2 was used, while pbmm2 was used for PacBio Iso-Seq (HiFi) data.
bash# ONT minimap2 -d ref.mmi ref.fa | \ minimap2 -ax splice -uf -k14 \ --secondary=no -Y -t 24 ref.mmi input.fq | \ samtools sort -o output.sorted.bam # PacBio pbmm2 index ref.fa ref.mmi | \ pbmm2 align ref.mmi input.bam output.bam \ --preset ISOSEQ --sort -
Transcript discovery & Quantification
Bambu is an R package for long-read based RNA-seq that performs a pipeline consisting of: (1) junction correction, (2) novel isoform discovery, and (3) quantification.
The inputs are an aligned BAM file, a reference genome in FASTA format, and a gene annotation file (GTF). First, the tool uses the annotation information to correct for alignment jitter and errors around splice junctions. The corrected reads are then clustered into isoforms, and novel transcript candidates not present in the reference are identified.
Finally, using an Expectation-Maximization (EM) based procedure, it resolves multi-mapping reads and shared exons to estimate transcript and gene-level expression. The outputs include an extended annotation file and count tables. Additionally, Bambu has a feature for visualizing the structures of the isoforms (Figure 7).bashbambuAnnotations <- prepareAnnotations(ref.gtf) se <- bambu( reads = input.bam, annotations = bambuAnnotations, genome = ref.fa ) writeBambuOutput(se, path)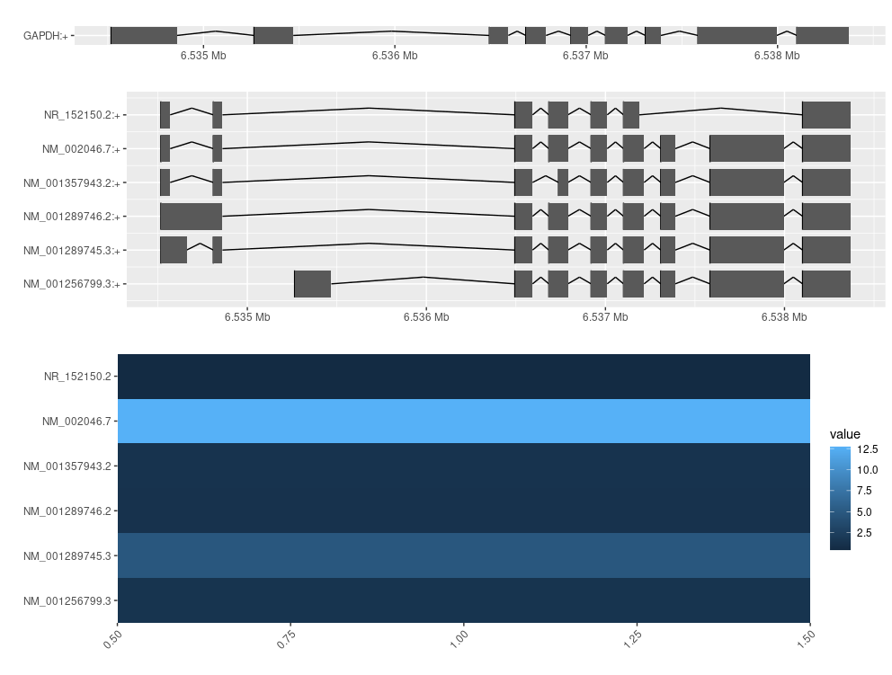
Figure 7. Visualization of transcriptome -
Isoform classification & Artifact filtering
SQANTI3 processes transcripts in two main stages: (1) Quality Control (QC) and (2) Filtering.
-
Quality Control (QC)
In the QC stage, the isoforms (GTF/FASTA) generated by the analysis pipeline are compared against a reference annotation (GTF) and the genome (FASTA) to assess and classify their structural quality. Each transcript is then assigned a label such as FSM (Full Splice Match), ISM (Incomplete Splice Match), NIC (Novel in Catalog), or NNC (Novel Not in Catalog). Furthermore, it evaluates the quality of termini and junctions by checking for canonical splice sites, proximity to TSS/TES (Transcription Start/End Sites), internal priming, and suspected RT-switching. It also summarizes length and structural statistics (Figure 8).
bashsqanti3_qc.py --isoforms bambu_results.gtf \ --refFasta ref.fa \ --refGTF ref.gtf \ -d directory \ -o output_prefix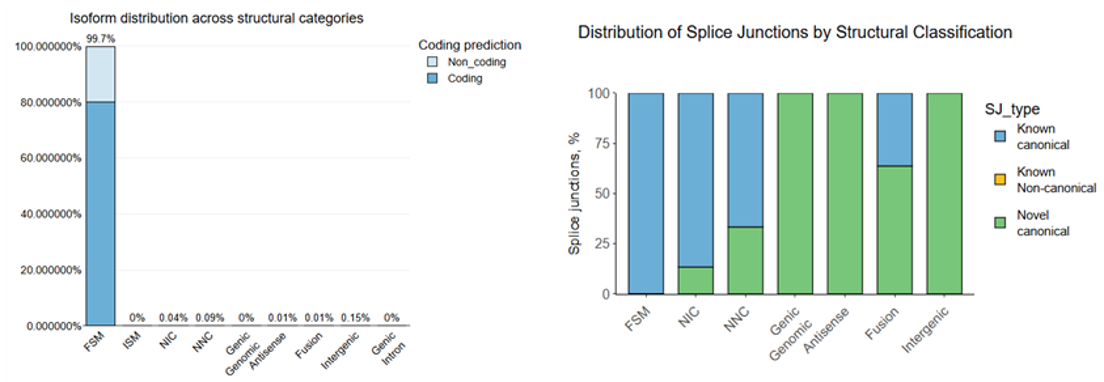
Figure 8. SQANTI3 Classification Results -
Filtering
The filtering stage uses the metrics calculated in the QC stage to remove potential artifacts with either a rule-based (rules) or a Random Forest-based (ML) approach, yielding a GTF/FASTA file that leaves only reliable transcripts. The default rules-based filter is designed to preserve FSM transcripts if there is no suspicion of 3′ intra-priming, and to preserve non-FSM transcripts only when they have no RT-switching and meet either the canonical or predefined long/short-read coverage criteria.
bashsqanti3_filter.py rules \ --quanti_class classification.txt \ --filter_isoforms corrected.fasta \ --filter_gtf corrected.gtf \ -e \ -o output_prefix \ -d directory
-
Quality Control (QC)
-
Downstream analysis
Transcriptome and isoform expression analysis is broadly divided into multi-sample comparison and single-sample analysis. In multi-sample comparison, data obtained from Bambu and SQANTI3 is first subjected to filtering (e.g., count ≥ 5 or CPM ≥ 1) and normalization (e.g., DESeq2, edgeR). Subsequently, significant changes are explored by quantifying differential expression at the gene and isoform levels (FDR < 0.05, |log2FC| ≥ 1), changes in isoform usage (DIU/DTU, |ΔIUP| ≥ 0.2, FDR < 0.05), and differential splicing events (DSE, ΔPSI ≥ 0.1–0.2, FDR < 0.05). This analysis helps in achieving an integrated understanding of the transcriptomic program under different conditions, including changes in the usage of alternative transcription start sites (TSS) and alternative polyadenylation (APA).
Single-sample analysis focuses on assessing the quality of transcripts and isoforms. In this process, transcripts are classified into categories such as FSM, ISM, NIC, and NNC, and their distribution is examined. Additionally, the frequency of major splicing events like SE (Skipped Exon), A5/A3 (Alternative 5'/3' Splice Site), and RI (Retained Intron) is summarized, and the characteristics of TSS, TES, and UTRs are analyzed. Finally, the visualization features provided by Bambu are used to visually inspect the structure of representative isoforms, allowing for a detailed examination of the structural features and quality of novel or anomalous transcripts.
C) Application of Transcriptomes and Isoforms
-
Analysis of Fusion Genes and Fusion Transcripts
Long-read RNA sequencing can capture fusion transcripts at the full-length level within a single read, thereby clearly identifying the breakpoint (at the base-pair level) and the junction direction. This supplements the limitations of short-read sequencing, which relies on inference from partial evidence, and directly contributes to the precise definition of diagnostic and therapeutic targets. In this study, we collect fusion candidates using chimeric/supplementary mapping information from long-read alignments and select high-confidence fusion transcripts based on criteria such as the minimum number of supporting reads, mapping quality, and preservation of the reading frame.
-
Functional Impact Assessment of Genomic Rearrangements
Large-scale structural variations can disrupt splicing boundaries and UTR/TSS/TES regions, leading to the induction of aberrant transcripts. Long-read RNA sequencing allows for the direct observation of these abnormal junctions, exon skipping/insertions, and rearrangement-derived isoforms, thereby confirming the actual state of the transcriptome—a result that is difficult to predict from the DNA level alone.
-
Rare Disease Diagnostics and Pathogenesis Elucidation
A significant number of rare diseases are caused by structural variations in reference-biased regions, areas adjacent to repetitive sequences, or deep intronic variants, making it difficult to identify the cause with short-reads alone. Long-read RNA sequencing directly detects pathogenic splicing, read-through events, and intergenic fusions with full-length reads, contributing to an increased diagnostic yield in cases where the cause was unclear with conventional DNA testing. Furthermore, by integrating this with variant information from the Korean pangenome to interpret population-specific transcriptomic abnormalities, it refines clinical classifications and potential therapeutic targets.